Simplify the decision-making process through the use of data
Data visualization
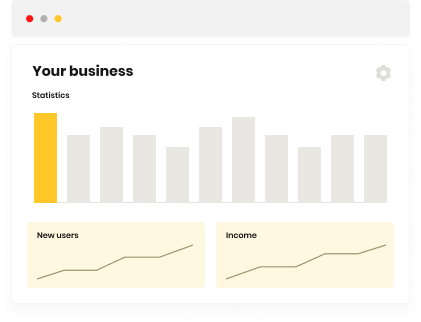
Our goal is to enable you to make business decisions supported by data collected and represented with information from your users.
Using data exploration techniques, we provide a set of KPIs specific to each business. The indicators are planned with a hierarchy that allows prioritizing their use based on the results and the question you are seeking to answer.



Differential value


Effective communication
Data visualizations can simplify the communication of complex information to different audiences, making it easier to convey insights and results to internal and external stakeholders.
Predictive capacity
By analyzing historical data and trends, data visualizations can provide predictive insights that help anticipate future user or market behavior patterns.
Strategic orientation
By providing a clear visual representation of key metrics and KPIs, data visualization helps strategically guide business decisions, identifying focus areas and growth opportunities.
Agility in response
By providing daily insights, data visualization enables agile response to changes in the environment, which is crucial in competitive and dynamic environments.
Working methodology
Definition of information needs
This stage involves a deep understanding of the end users, their roles, responsibilities and objectives, as well as the available data and the problems to be addressed.
It is essential to define which KPIs will guide the course of decisions in order to generate them.
Planning and implementing measurement
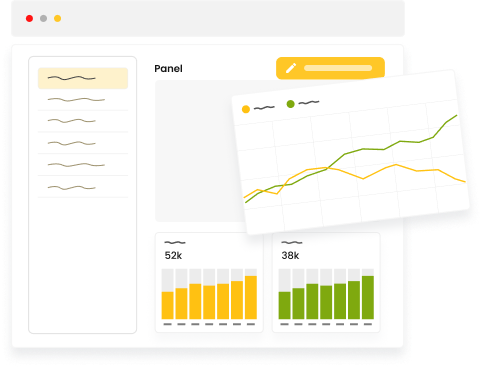
Define the objectives you want to achieve with web analytics, select the appropriate tools and implement them on the website
Anomaly Detection Analysis
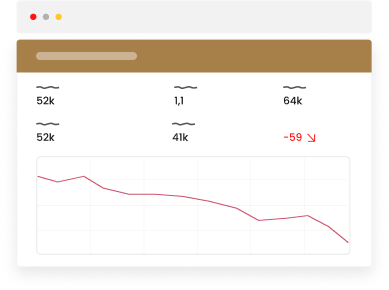
Once the solution is implemented, an analysis is carried out to extract findings from the patterns identified in the information and, especially, from the anomalies in those patterns.
All deviations detected in key KIPs allow us to understand the causes and impact of those changes in order to promote positive ones and avoid negative ones.
This analysis is aimed at delivering concrete actions to the business areas while testing the value proposition of the visualization tool.
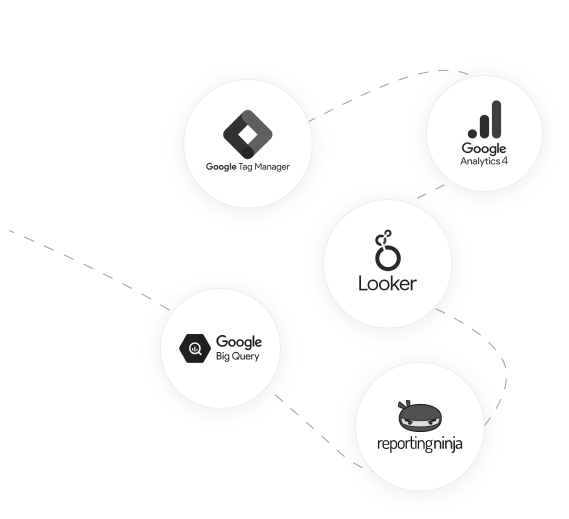
We work with the best tools
We generate data integration in the most efficient way for the needs of each business and connect these sources of information to a visual environment that is user-friendly for any type of user.
The different tools available help us to standardize the information and ensure that its visualization does not generate inconsistencies.
Your partner in growing your project
We help companies like yours

I really value iSocialWeb’s ability to adapt to the needs of a start-up depending on the phase of its life cycle. At Housfy, we hired them just when we were starting out and it was a real success. I would say about them: dedication, strategy and growth.
Albert Bosch
CEO
Team
More than 30 specialized professionals around 1 objective: Helping you improve your digital business.
Since our beginnings, we have generated more than €400 million extra for our clients and managed more than 1 billion annual visits.
In addition, we have appeared in:


Analytical articles of interest
Tell us your case
One of our specialists will assist you
or send a message:
Fields marked with * are required. DATA PROTECTION INFORMATION OF ISOCIALWEB MARKETING S.L., Purposes: Respond to your requests and send you commercial information about our products and services, including by email. Legitimation: Consent of the interested party. Recipients: The information provided may be shared with our marketing and IT service providers, as well as providers that help us provide digital services. Rights: You can withdraw your consent at any time, as well as access, rectify, delete your data and other rights at [email protected]. Additional Information: You can expand the information in the Privacy Policy link.
